
Northumberland County has a mandate for community services such as Affordable Housing, Paramedics, the Golden Plough and income support (welfare) as well as county roads, garbage and economic development. To better understand what residents see as priorities for a range of such services, a survey was conducted from 25 June to 31 July. Public surveys usually get few participants and this was no exception with only 143 responses received. Of these, 61 were Cobourg residents. Of the 143, 46 were over 59 years of age, 60 were 39 to 58 and 29 were 18 to 38. The results are interesting and will guide the County’s “Community Safety and Well-being Plan”.
Major categories were “Personal Safety”, “Feelings about Crime”, and “Environment and Culture” – details on these below. Despite all the recent discussion on affordable housing, of the 24 priorities listed, affordable housing was ranked the lowest [Oops A rank of 1 is highest so affordable housing is highest priority – thanks Kate]. And the questions on safety seem to be outside the County’s scope since they are not responsible for policing.
Personal Safety
Q. How do you feel about your personal safety?
Feel safe all the time 40
Feel safe most of the time 84
Neither safe nor unsafe 8
Feel unsafe most of the time 6
Feel unsafe all of the time 3
Feelings about Crime
Q. Over the last 3 years, do you feel crime has increased?
Increased significantly 31
Increased somewhat 58
Remained the same 44
Decreased somewhat 4
Decreased significantly 1
Environment and Culture
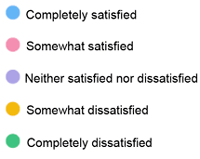
Q. Please rate your satisfaction with the accessibility (location and affordability) of the following activities or services in your community.
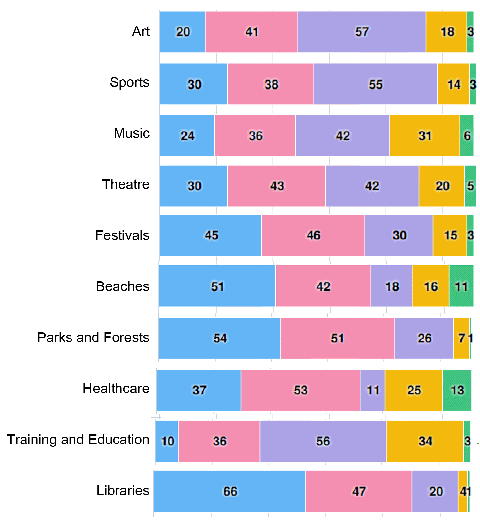
Priorities
High priority is a low number.
| Affordable housing | 2.33 |
| Housing and homelessness | 3.43 |
| Mental health | 3.67 |
| Opportunities for employment and employment skills development | 3.98 |
| Access to services | 3.98 |
| Substance misuse/addictions | 4.26 |
| Poverty and income | 4.32 |
| Crime prevention | 4.58 |
| Food security | 4.79 |
| Coordination between services in the community | 4.82 |
| Support for youth that are vulnerable/at-risk | 4.84 |
| Personal and overall community security and safety | 4.95 |
| Community belonging | 5.00 |
| Aging in place | 5.33 |
| Healthy childhood development | 6.81 |
| Accessibility for persons with disabilities | 7.23 |
| Age friendly initiatives | 8.00 |
| Anti-racism initiatives | 8.24 |
| Traffic safety | 9.06 |
| Other | 10.00 |
| Human trafficking | 11.75 |
| Intimate partner violence | 13.22 |
| Anti-homophobia initiatives | 15.88 |
| Injury prevention | 17.00 |
Is this really representative of the priorities of people in Northumberland? And many issues don’t seem related to what the County does – e.g. they are Police matters.
One wonders what actions the County will be actually taking with its “Community Safety and Well-being Plan”. And will it be based entirely on the results of this survey which seems to have strange results?
Links
Print Article:
Perhaps the low participation rate is result of a couple of factors including surveys generally have very low participation rates to begin with and we were several months into a global pandemic where most people were just trying to survive (job losses and financial hardship, mental health, health of loved ones, etc..) and maybe not overly concerned about human trafficking, community belong and coordination between services. Not to suggest these aren’t all important however there needs to be a readiness for this type of survey initiative and I think the county missed the mark. I would suggest the County not make any decisions based on this survey – the data sample is far too small and peoples options/feelings may have been biased as a result of all that was/is going on around them.
Economic Development is once again, conspicuous by it’s absence…
It looks like the County was taken to the woodshed on this survey.
Noting that the site had a meagre 636 visitors; only a measly meagre 143 bothered to vote. Less than one in four voted. Out of a total population in excess of 85,598 (2016) less 20 percent for those under 18, so lop off 10,000 arbitrarily, and 636 visitors, leaving 74,962 who did not show up at all. A few months ago, people were clamouring for toilet paper, a useful product, but there was no clamouring for this survey. One in 118 people of Northumberland bothered to visit and only one in four of that meagre group bothered to vote.
Based on such flaccid results, the government of Northumberland will 1. Analyze results and then 2. Align with Situation table data, crime and incident data from Police, EMS and Fire and then 3. Align with other local data from youth, homelessness, income, employment, education and courts/justice and 4. Synthesize with Housing and homelessness plan priorities from which it can 5. Determine top priorities for Northumberland plan and 6. Align with strategic objectives including County, Health, Police and other sectors. They’s agonna Analyze, Align, Align again, Synthesize, Determine and, finally, Align once again.
This is known as the AAASDA formula first applied to Blandhattan’s myriad neighbourhoods by leaflet. The survey results were disproportionally meagre by an order of magnitude. There was little to align and align and align with. This skewed the final SDA. The AAASDA was confined to the vaults of misaligned policies, but does rear its head in the academic community chosen as a bad example. So students have been known to have infiltrated copies of this policy into small municipality governments. So it is a govern mental problem.
Many.surveys are worded to get the results the sponsor wants. Many play on new investment and improvements for only a few pennies more on our taxes.
Hogwash. How about a survey on efficiency, prudent spending and accountable government?
And how did the County get its survey out? Did I miss something on this site, John? Usually I’m a sucker for doing surveys. Didn’t see this one.
Yep like you I missed this one, dunno how?
Why was it not broken down into Regions ????
Again we see a completely useless study , Just showing us Generalities
I raised this in the Past with the numbers and pricing when it came to the Averaging of County statistics to determine affordable Rents $900.00 Come On ???? This may achieve what the County wants to show but rental reality in Warkworth Hastings and Campbellford are no where near the actuals in Cobourg of 1 bed rm at $1685 . 00 plus heat , utility Phone and cable . and I am not talking match box or single rooms .These numbers actually hinder progress investment in this area when builders are looking for communities to develop in . Crime rates as posted a few months ago
showed huge problems in Cobourg Central along the water front north to University Ave, Not so in Hamilton Twsp
Can’t we be more precise Then may be regional issues can be Corrected .
On the surface, it looks like this survey accomplished really nothing. How much did it cost??? And what could staff have done with their time, to good advsntage, while they spent time (wages, etc) on this project?
Don’t worry too much about wasted wages since staff were “working from home” on full pay anyway. However, mowing their lawns would have been more useful than the survey.
Do we know how many homeless people are local and how many are from outside our area
It doesn’t matter whether they are local or “out of towners” we Canadians have real problems on our hands if we don’t try to get the homeless situation under control. Too many people are ignoring the situation as it now stands